A lawsuit coming out of Wisconsin may change that. The case relies on the "efficiency gap." This is a measure of wasted votes, those votes that don't contribute to victory. The votes for a losing candidate are all wasted. All votes for a winning candidate over 50% are wasted. The goal in gerrymandering is to maximize the other party's wasted votes while minimizing your own. If the GOP candidates routinely win with margins of 55% and Dems routinely win with margins of 85% this is evidence of gerrymandering. This math can be applied without bias.
Will Kennedy see a formula he can love? Will a fifth liberal justice break the tie? This is a lawsuit to watch.
For the wonky among us Nicholas Stephanopoulos, writing for the New Republic in 2014, fills in the details of how to compute an efficiency gap:
Suppose, for example, that a state has five districts with 100 voters each, and two parties, Party A and Party B. Suppose also that Party A wins four of the seats 53 to 47, and Party B wins one of them 85 to 15. Then in each of the four seats that Party A wins, it has 2 surplus votes (53 minus the 51 needed to win), and Party B has 47 lost votes. And in the lone district that Party A loses, it has 15 lost votes, and Party B has 34 surplus votes (85 minus the 51 needed to win). In sum, Party A wastes 23 votes and Party B wastes 222 votes. Subtracting one figure from the other and dividing by the 500 votes cast produces an efficiency gap of 40 percent in Party A’s favor.
A few years ago I created some gerrymandering examples to make sure I understood the concepts. Perhaps now is a time to share them.
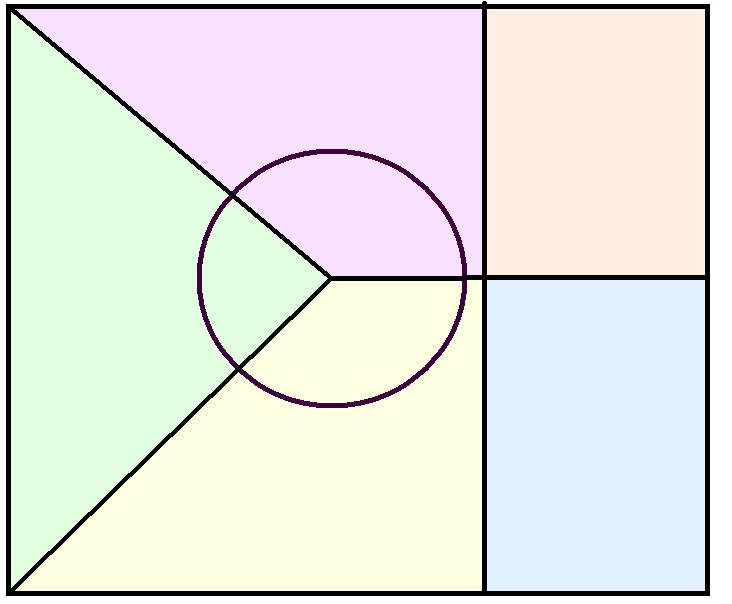
Consider a region with 5000 people, to be divided into five districts. Each district is to get 1000 people. There is a central city (the circle) of 2000 people and surrounding suburbs of 3000. To make the math easy, the city is entirely Democratic and the suburbs are entirely GOP.

In case 1 the city is divided into 3 districts that also include adjacent suburbs. The 666 city residents in each district would overwhelm the 334 suburb residents. Wasted votes are 165 Democratic and 334 Republican for the city-suburb districts and 499 for the two entirely suburban districts.
165 * 3 = 495, 334 * 3 = 1002, 499 * 2 = 998. Dems waste 495 votes, GOP waste 2000.
2000 – 495 = 1505, 1505 / 5000 = 30%. This method of drawing districts is 30% in favor of the Democrats.
In case 2 the city is divided into 5 districts that also include the adjacent suburbs. The 600 suburban residents in each district would overwhelm the 400 city residents. The wasted votes are 400 Democratic and 99 GOP.
400 * 5 = 2000, 99 * 5 = 495. Dems waste 2000 votes, GOP waste 495 (hmm.).
This method is 30% in favor of the GOP.

In case 3 the city and its adjacent suburbs are divided into 4 districts. One district is entirely GOP. In this case we'll consider each party won two districts by the narrowest of margins, 501 to 499.
For both parties there are 2 * 499 wasted votes, plus 499 for the entirely suburban district. The Dems have 998 wasted votes, the GOP have 1497 wasted votes.
1497 – 998 = 499, 499 / 5000 = 10% in favor of the Dems.

Stephanopoulos again:
Second, as an arithmetical matter, the efficiency gap represents a party’s undeserved seat share: the extra fraction of seats a party wins relative to a neutral plan. Above, for instance, if Party A and Party B had each wasted the same number of votes, Party A would have won two seats and Party B three. Instead, Party A won four seats, or 40 percent (two out of five) more than it should have. This is precisely what the efficiency gap reveals.
In my examples, each seat is 20% of the total. In my first two cases the score shows one party got one more seat than they should have. In my final example the score is less than one seat, so the district map is good.
Another way to look at it: In cases 1 and 2 the candidates are essentially chosen in the primaries, so the more extreme candidates win. But in my 3rd case the extreme candidates won't fare well in the general election. The four moderate candidates would withstand the possibly extreme candidate from the entirely suburban district.
Stephanopoulos also shows how the formula was applied in elections since 1972. And yes, the most gerrymandered election since then was 2012 (his article came out before the 2014 election).
This formula now gives numbers that can be taken to the Supremes. The Court has said districts can deviate by no more than 10% in population. This could correspond to an efficiency gap above 2 seats in a state with 8 or more seats. Will the Supremes go for it? Maybe not soon. But if enough Circuit courts do it may not matter.
No comments:
Post a Comment